Why do we use probability distributions?
- StatisticaHub
- Mar 23, 2023
- 3 min read
Updated: Jun 13, 2024

While learning probability, we usually hear examples of coin tosses, card games, numbered balls etc.
We need to get really practical to apply concepts about probability to solve problems. But before that we need to go through some conceptual matters. This article help you develop some key terminology that we’ll need to understand how to apply it to our real-life problems.
What is probability?
Simply saying, Probability is about interpreting and understanding the random events of life. “It is the long-term chance that a certain outcome will occur from some random process” so, it basically tells you how often different kinds of events will happen.
Example: In Finance, by estimating the chance that a given financial asset will fall between or within a specific range, it’s possible to develop trading strategies to capture that predicted outcome.
So, numerically a probability is a number that ranges from 0 (the event will not happen “Impossible event”) to 1(the event will happen for sure “Certain event”) the bigger the value of probability, more likely the event is to occur. If you take all possible outcomes and add them, you’ll get 1.
Example: Probability of rain tomorrow is 40%; P(rain)=0.4
Probability of going to college is 2%; P (going college) =0.02
In the first case we are interested in the variable “rain” and in the second variable “going college”. These types of variables or any other variable that is a result of random process, referred to as “Random Variable”.
A “Random Variable” is a variable that is subject to random variations so that it can take on multiple different values, with their respective probability.
Probability distributions:
A probability distribution is a list of all of the possible outcomes of a random variable, along with its corresponding probability values.
Example: If we take diseases samples from different individuals at a given place, we can calculate the probability distribution of their disease types:
Disease Type | Diabetes | Dengue | Malaria | Blood Pressure |
Probability | 0.30 | 0.50 | 0.15 | 0.05 |
Here, we are counting the no. of individuals with different diseases, and then divide each disease type group by the total amount of individuals. In this way we get the probability of each disease type.
Disease type is the random variable. Probability distribution shows that individual with disease type “Dengue” have the highest probability of occurrence.
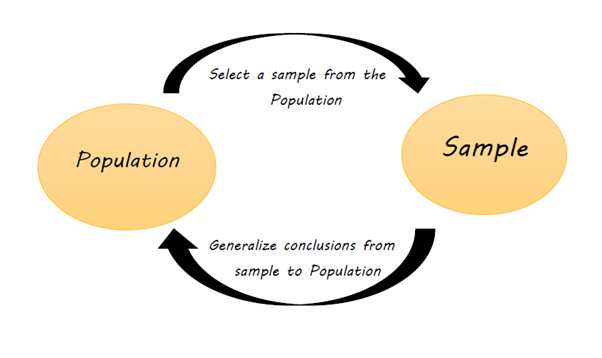
But the important thing to notice here is when we estimate the probability distribution of a random variable what we’re actually doing is using data that represents only a part of the real behaviour of that random variable that we’re analysing. We are not looking at all the possible data values (defined as “population”), as we obtained data from a subset of it (referred as “sample”) in a given point in time and space.

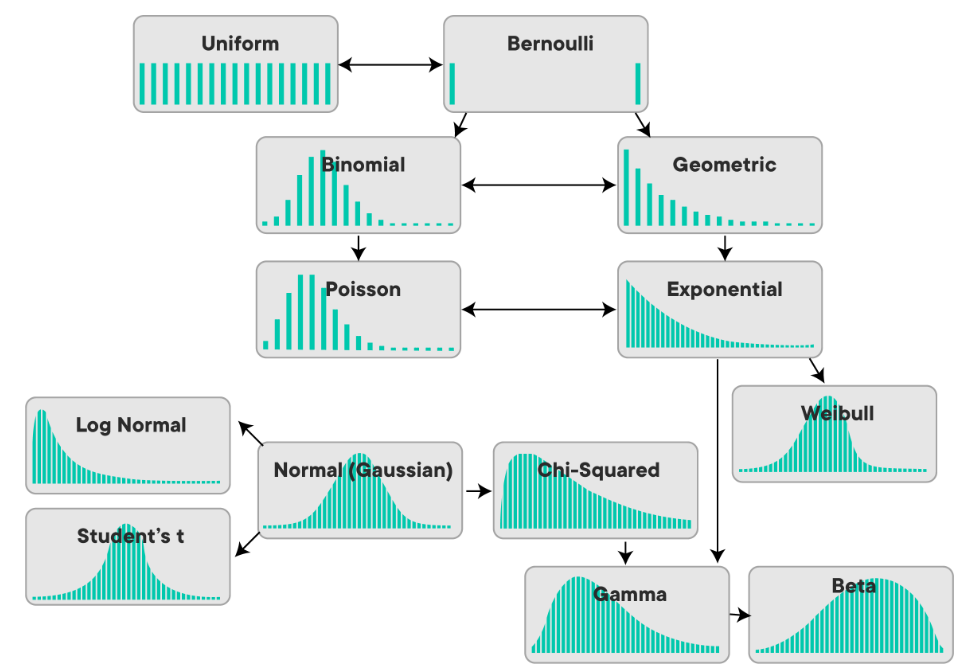
So, there are probability distributions models that help you predict outcomes in specific situations. And lots of probability distributions models exist for different situations, and the most important point is we have to select right one that fits our data.
Simply saying, “Probability distribution model is a guide we use to fit a random variable in order to generalise its behaviour”.
Types of Random Variables:
There are two major types of random variables:
· Discrete random variables: The ones that have finite or countably number of possible outcomes.
· Continuous random variable: The ones that have an uncountable infinite number of possible values.
There are different probability distributions model for each one of them. This means that if we’re dealing with a discrete random variable, we need to select a probability distribution model that handles discrete random variables we can’t choose one that deals only with continuous random variables.
“Probability and statistics are so connected that it is impossible to talk about one without mentioning the other”.
Statistics are applied to sets of data to determine factors or attributes that characterize them and gain the information. A statistic is a numerical measure that describes property of data.
The part of statistics that only describes data is called “descriptive statistics”, while the part of statistics that allows you to make predictions is called “inferential statistics”.
Probability distributions help to model our world, enabling us to obtain estimates of the probability that a certain event may occur, or estimate the variability of occurrence. They are a common way to describe, and possibly predict, the probability of an event.


Comentarios